
San Pablo, Bolívar | |
|---|---|
Municipality and town | |
 Flag  Seal | |
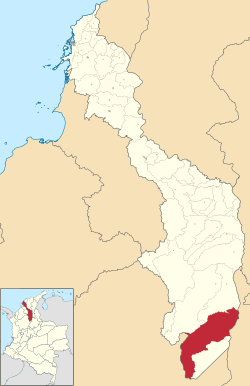 Location of the municipality and town of San Pablo, Bolívar in the Bolívar Department of Colombia | |
| Country | |
| Department | Bolívar Department |
| Population (2020 est.[1]) | |
| • Total | 37,160 |
| Time zone | UTC-5 (Colombia Standard Time) |
San Pablo is a town and municipality located in the Bolívar Department, northern Colombia.
Climate
| Climate data for San Pablo (Col Cooperativo), elevation 165 m (541 ft), (1981–2010) | |||||||||||||
|---|---|---|---|---|---|---|---|---|---|---|---|---|---|
| Month | Jan | Feb | Mar | Apr | May | Jun | Jul | Aug | Sep | Oct | Nov | Dec | Year |
| Mean daily maximum °C (°F) | 33.7 (92.7) |
34.0 (93.2) |
33.7 (92.7) |
32.8 (91.0) |
32.5 (90.5) |
32.8 (91.0) |
33.1 (91.6) |
32.8 (91.0) |
32.3 (90.1) |
31.8 (89.2) |
32.0 (89.6) |
32.9 (91.2) |
32.9 (91.2) |
| Daily mean °C (°F) | 28.7 (83.7) |
28.9 (84.0) |
28.8 (83.8) |
28.2 (82.8) |
28.1 (82.6) |
28.3 (82.9) |
28.4 (83.1) |
28.3 (82.9) |
27.9 (82.2) |
27.6 (81.7) |
27.8 (82.0) |
28.4 (83.1) |
28.3 (82.9) |
| Mean daily minimum °C (°F) | 23.2 (73.8) |
23.3 (73.9) |
23.6 (74.5) |
23.6 (74.5) |
23.5 (74.3) |
23.5 (74.3) |
23.3 (73.9) |
23.3 (73.9) |
23.2 (73.8) |
23.2 (73.8) |
23.4 (74.1) |
23.4 (74.1) |
23.4 (74.1) |
| Average precipitation mm (inches) | 26.5 (1.04) |
67.5 (2.66) |
105.2 (4.14) |
244.0 (9.61) |
347.2 (13.67) |
283.0 (11.14) |
286.8 (11.29) |
360.8 (14.20) |
367.4 (14.46) |
359.1 (14.14) |
223.1 (8.78) |
61.7 (2.43) |
2,730.1 (107.48) |
| Average precipitation days (≥ 1.0 mm) | 2 | 4 | 7 | 13 | 16 | 14 | 14 | 16 | 17 | 18 | 12 | 5 | 139 |
| Average relative humidity (%) | 73 | 73 | 73 | 76 | 76 | 75 | 75 | 75 | 76 | 77 | 77 | 75 | 75 |
| Source: Instituto de Hidrologia Meteorologia y Estudios Ambientales[2] | |||||||||||||
References
- ^ "Resultados y proyecciones (2005-2020) del censo 2005". Retrieved 17 April 2020.
- ^ "Promedios Climatológicos 1981–2010" (in Spanish). Instituto de Hidrologia Meteorologia y Estudios Ambientales. Archived from the original on 15 August 2016. Retrieved 3 June 2024.
7°28′57″N 73°55′30″W / 7.48250°N 73.92500°W
This Bolívar Department location article is a stub. You can help Wikipedia by expanding it. |